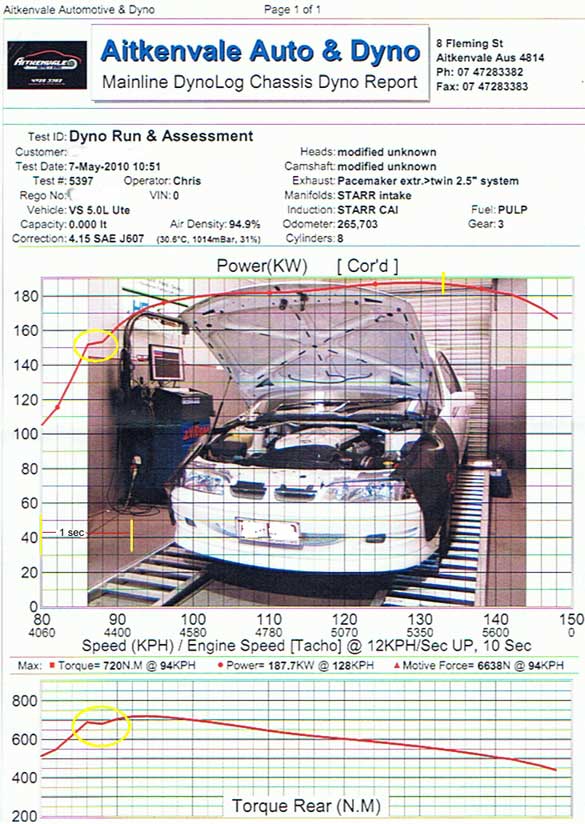
I received a dyno report from one of my mates when I was in the Army and decided to do my own report on it. The first chart is nearly exactly what my charts looked like on the Dyno Dynamics dyno except for the pretty picture. Computers are now used to plot curves and these show the operator and the customer lots of useful information. I have included four graphs below and can see that there is a problem with the results. I cannot make a full assesment of the exact problem as I wasn't present during the test, however I will make some educated guesses.
This car is under full throttle in 3rd gear and accelerating at an up ramp of 12KPH/sec. Each vertical division equals .16 seconds. First item to take note of is the yellow circled area in the Power & rear torque graphs. A sudden levelling in HP and torque at approx 4300RPM. This occurrence is not isolated to just these two graphs. Check the other two graphs and you see that a similar bump in the curve happens at the same RPM. In the scheme of things the small bump lasts only .16secs. It happens so quick that from the drivers point of view, nothing is probably noticed and in my opinion this bump has little to no significance but I will speculate further down of what it might be.
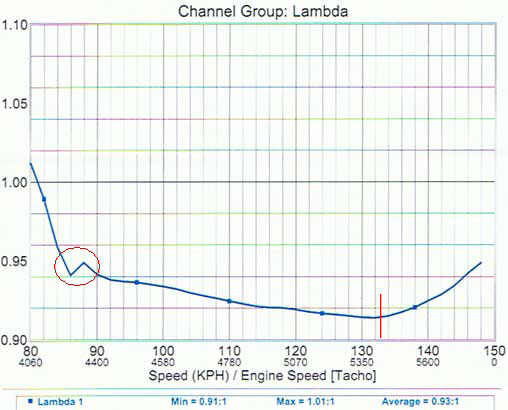
This graph below shows the oxygen sensor readings during the test. It starts around Lambda and then quickly starts to richen as it should. But then a hiccup, suddenly it reverses and leans back slightly then approx 50rpm later it starts it decent again as it should. As I said nothing to be concerned about. It keeps slowly increasing the fuel mixture strength until about 5400rpm then starts to lean off. This is also a worry. Perhaps if the curve flattened out at 5400 the engine might have still produces a flat HP curve on the chart above instead of loosing HP as it did. The next graph is the intruiging one.
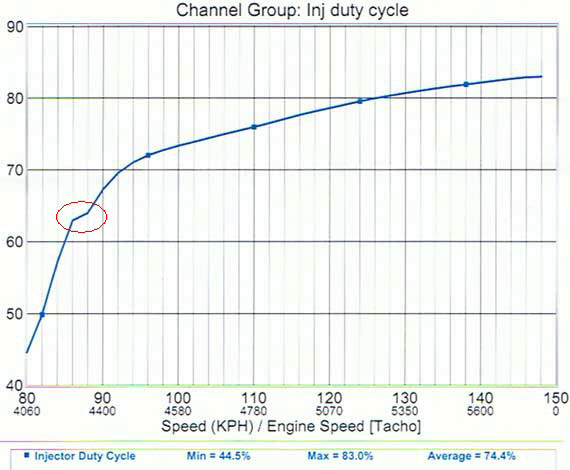
The graph below is for the duty cylce of the injectors. The injectors are either on or off. Duty cycle refers to the on time of the injector compared to the off time. ie. 80% duty cyle would mean that the injector is held open for 80% of the time and closed for 20% of the time. This is a standard measurement to determine if the injectors are correctly sized for the engine for fuel flow purposes. As you can see the duty cycle is at approx 80% on time, at full power. If they were on 100%, the flow rate of the injectors would be too small and larger flow injectors would need to be fitted. If the duty cycle was 50% or less then the injectors would be too big and subsequentely would need to be down sized. There are also two points of interest in this graph, just like the others except I have only marked one. Can you see the other before I start to talk about it, I have marked it on the power graph. The first one is obvious, the sudden decrease in rise of the duty cycle may be responsible for all the other bumps. Take a look. Suddenly the duty cycle slows for a bit when it should be rising sharply. This will of course, cause the lean dip in the lamba curve. Correct, it did. The flow on effect is small loss of torque and horsepower at the same point. So what could be the cause of the decline in injection duty cycle at this point. I believe the system is an aftermarket ECU specially programmed for all the mods that were done to the engine. Perhaps there is a calibration error at this one point?? I can only speculate because I was not there and I need more information than I currently have. Whatever the cause, I would not bother chasing it, because as I said earlier the blimp is so small it really probably has no impact that should be of concern. Now the second area to make note of, did you see it?? Take a look at the Lambda graph from the red line onwards. It shows the mixture going lean but this graph is showing the duty cycle going higher as you would expect. Higher duty cycle means more fuel injected. Once the mixture started to lean off, the power curve started to decline somewhere at the yellow marker line. I don't know the cam specs so can't determine if the cam has reached peak KW@ advertised RPM but I believe that this cam may be good for a bit longer than 5500rpm. So why is more fuel delivering a leaner mixture?? Wait on, didn't I just say higher duty cycle means more fuel. Then if that statement is true, something doesn't add up. I reckon that the engine started to mis-fire at approx 5400rpm and just got worse. How can I assume this? Very quickly, The oxygen sensor measures excess oxygen. The richer the mixture the less oxygen is present in the exhaust, which will show a Lambda reading lower than 1.0. When a misfire occurs, more oxygen is present in the exhaust as it was not burnt with the fuel. This will register a higher Lamda value so the curve turns around and heads back towards Lamda 1.00. Logical really.
In conclusion, if the engine was not mis-firing, the next thing I would be inclined to test, is the fuel pressure and the fuel delivery of the pump at working pressure to see that it is actually suppling the fuel. But I believe I hit the nail on the head with the engine miss firing. On my dyno misfiring shows a very rough plot line as the HP jumps up and down. On modern laptops the software smooths this out, so better to be there to see what was going on in person. So there you have it, just a small sample of data that can be derived from a dyno run.